How to graph IEP progress monitoring data: aim line vs. trend line
If you graph IEP progress monitoring data on paper, in a spreadsheet or on the back of an attendance sheet, the special education graph that matters has two lines and a handful of dots. Draw those three things honestly and the graph answers the only question worth asking at the table: is the teaching working, or is it time to change it?
Everything else, the colors, the legend and the clip art star, is decoration.
What do you need before you graph IEP progress monitoring data?
Three things, and the first one is the one people skip.
A measure that stays the same. Words read correctly in one minute on passages of the same difficulty. Problems right out of ten on the same kind of probe. Minutes on task during the same work block. Change the passage level or the number of problems halfway through and the dots stop being comparable. They’re just dots.
A baseline. Where the student started, before the new teaching. One score is a bad day or a good one, so take three short checks in the first week or two and use the middle score.
The goal and its date, copied straight from the IEP. “Seventy words correct per minute by the end of May” is a point on the graph. “Improve reading fluency” is not.
How do you draw the aim line?
Across the bottom go the dates, or the check numbers if you check on a rotation. Up the side goes the measure, starting at zero and running a little past the goal so the goal isn’t jammed against the top edge.
Put a dot at the baseline, on the date you took it. Put a second dot at the goal, on the date the IEP names. Draw a straight line between them with a ruler. That’s the aim line: the route the goal assumed.
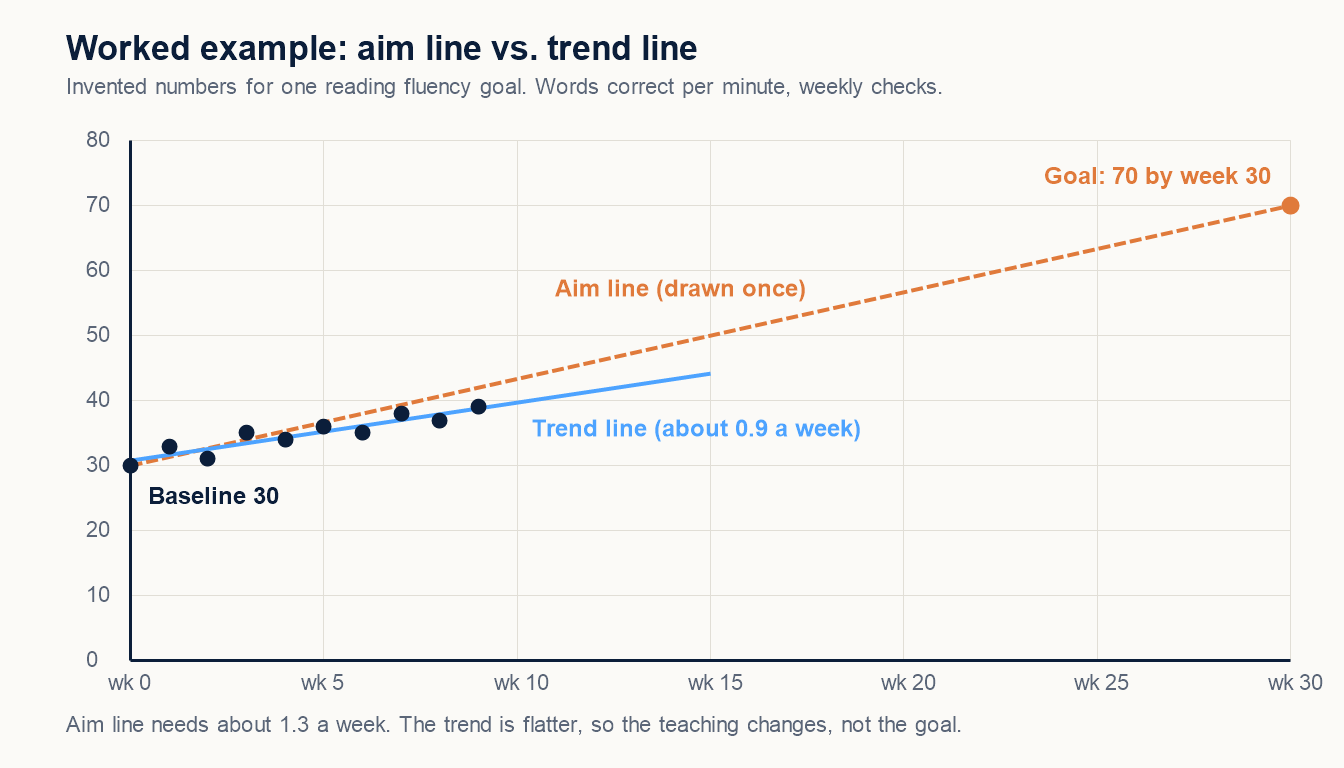
Draw it once. Don’t redraw it later to meet the dots where they are, and don’t slide the goal down to make a flat line look fine. The aim line is only useful because it holds still.
How do you add the data points?
One dot per check, on the date of the check, at the score. Connect the dots with a thin line if you like, but don’t connect a dot across a gap longer than a school break; a week out sick is information, not a straight line.
Mark anything that would change how a reader sees a dot. A small note at the bottom, “new passage set,” “fire drill,” “first week back from winter break,” takes a pencil and two seconds and saves a meeting from guessing. If you already mark checks on an IEP data collection sheet, the dates and notes are sitting there waiting to be copied over.
What is the difference between an aim line and a trend line?
The aim line is the plan. The trend line is what actually happened.
Once there are six or more dots, draw a straight line that runs through the middle of them, with about as many dots above it as below. That’s the trend line. A spreadsheet will draw one for you from a line chart; a ruler and a steady hand get close enough for a data meeting.
Then compare the two. Trend steeper than the aim line: the student is ahead of the route, and raising the goal belongs on the next meeting’s agenda. Trend running alongside it: keep going. Trend flatter than the aim line: the student will miss the goal on this road, and the road needs to change.
How many points below the aim line before you change something?
Teams use rules of thumb, not law. A common one: if three or four checks in a row fall below the aim line, change the instruction. Another: after six to eight checks, if the trend line is flatter than the aim line, change the instruction. Ask what your district uses, then write the rule at the top of the graph so everybody at the table reads the same picture.
“Change the instruction” is the important half. More modeling, smaller steps, a different time of day, more practice turns. It never means lowering the goal because the line is flat. Slower is not limited. The graph is grading the plan, not the child, and the plan can take it.
When you change something, draw a vertical line on the graph on that date and write what changed. The next six dots then tell you whether the change worked, which is the whole point of progress monitoring in special education.
What should families see on the graph?
The same graph, with words. Families don’t need “slope” or “trend analysis.” They need three sentences: where the student started, where the student is now, and what happens next. Point to the baseline dot, the latest dot and the aim line while you say them.
If the line is flat, say that plainly and say what’s changing. A family that sees a flat line with a plan next to it trusts the next graph. A family that finds out in May doesn’t trust any of them.
Keep the graph in pencil until the quarter closes. You’ll want to add a note about Tuesday. There is always a note about Tuesday.